Experimental Proof of Concept

Insurance Agency Adoption of Robust Universal Address Data

This proof of concept is solely created to illustrate some of my design thinking as it could relate to the insurance industry. "TMRW Insurance" is a fictional company for this exercise. It contains many assumptions and high level ideas that would require further research to fully formulate. My goal is to show how a small upgrade to something like a data point could be used wisely and make a big impact. Wireframes best viewed on a desktop screen.

BACKGROUND

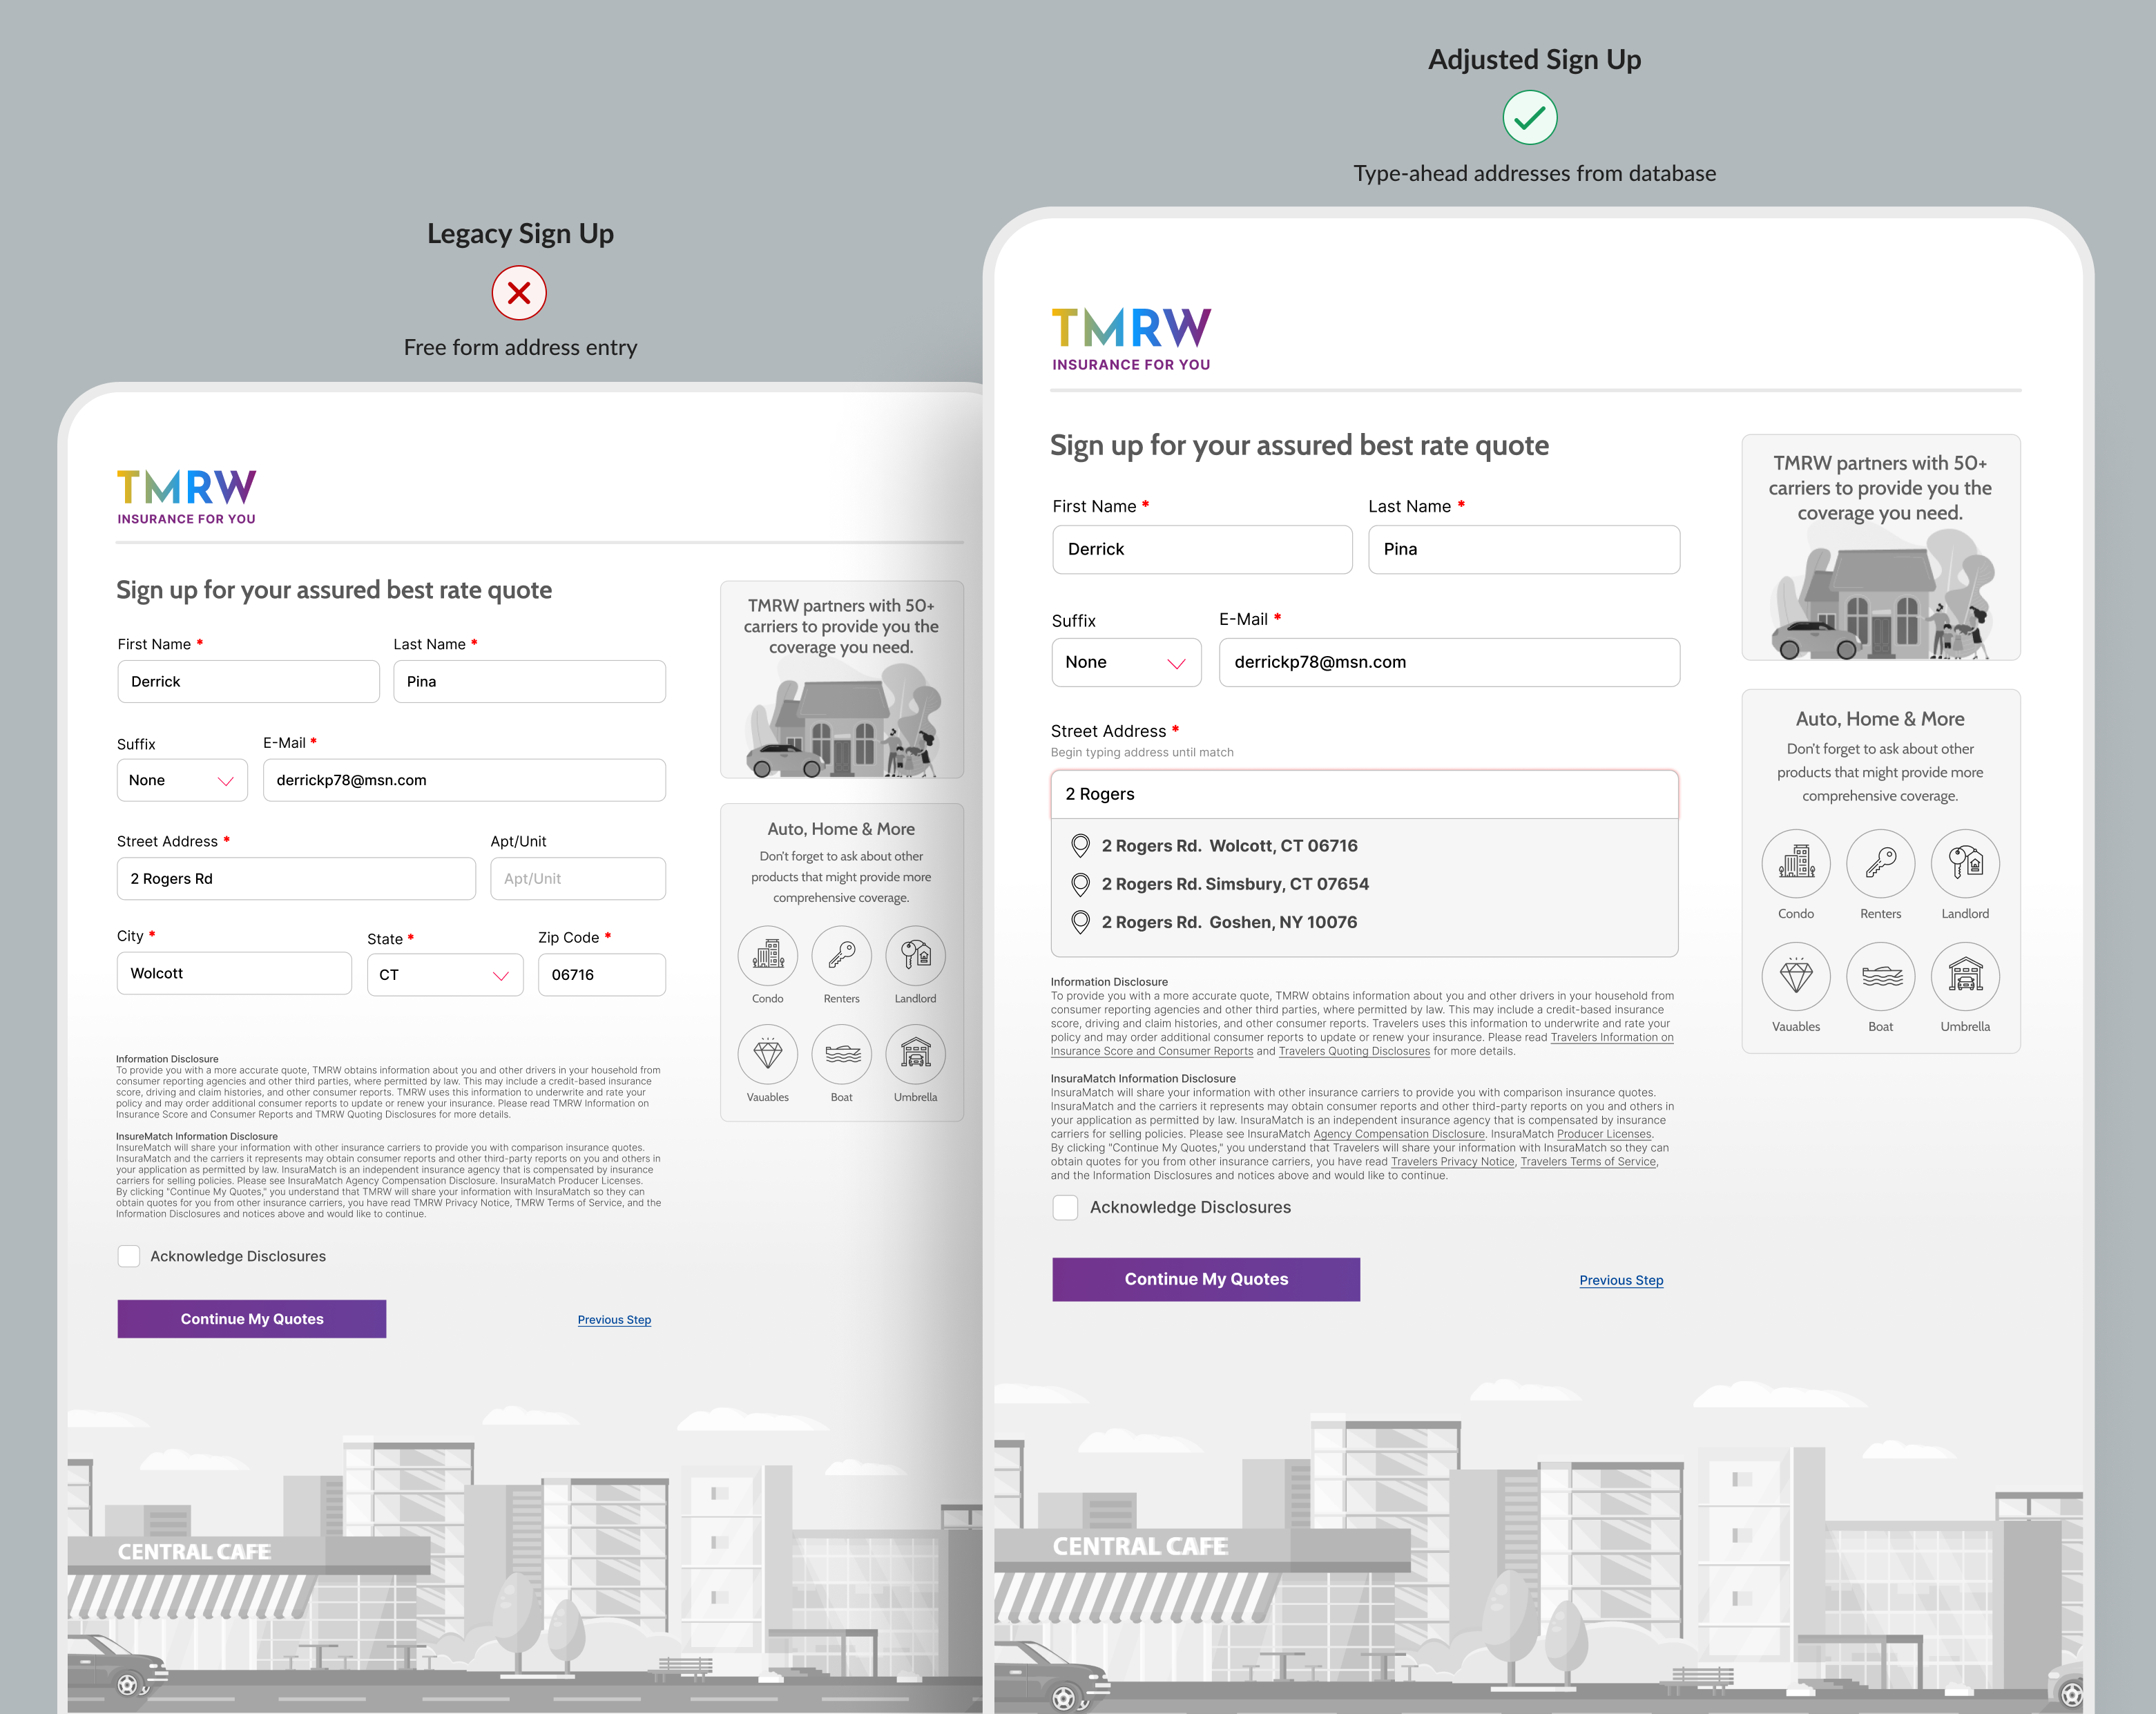
While working at my previous stop, Fubo Sportsbook, an important part of onboarding new bettors was "KYC" or "Know Your Customer". With strict industry regulations, a third party had to verify that the users are who they said they were, and located in a legal gambling state. Often times, misspellings and incorrect formatting of the ways users entered their street address would cause verification failures. So, we worked hard to implement a type-ahead address API to mitigate human entry errors.

As I was interviewing for a position in the insurance industry I noticed their customer sign up flow had the free form address fields. This made me ponder how collecting better address data could help the company and customer, and also other ways accurate address data can be utilized across an insurance organization.

For this exercise I'm simulating that this company TMRW has had the opportunity to overhaul its backend and APIs, which will put them in a new position to better track customer's locations and accidents across the country. This new system could translate and store incidents received by both claimants and public data in an accurate, normalized format which contain address data, as well as geo-coordinates. These incidents could accurately be plotted on maps, searched by street, city, state etc, and can be cross referenced with accident data available from national, state, and local bureaus. In addition to the addresses, the new database could store notes and tags from the accident report as searchable entities.

Armed with the ability to better track accidents and where they occur, what can TMRW do with this information to improve their auto insurance business, to better protect themselves from exposure and also inform their valuable customers of potential hazards on the road?

Address Data Attributes
Who potentially benefits from this new data?
Jennifer Portrait
Jennifer - Sales Agent
"I'm always looking to get the customer a better rate so they'll choose us over the competition. I also need to make sure I'm giving appropriate rates based on driving habits and other mitigating factors."
Sean Portrait
Sean - Risk Mitigation
"I need to ensure that TMRW is not always paying out claims for incidents that happen time after time on the same stretch of road. I work with deprtments of transportation to address trouble spots."
Seth Portrait
Seth - Customer
"I want more than just an auto policy. There are a lot of companies to choose from. I like to know my insurance company is looking out for me with great customer service."
Starting with better address collection at sign up

Instead of a free form address, city, and zip code field as exists during new customer sign up today, a customer's home address would be selected from a list that would be populated when they start entering their address. These addresses are pulled from the normalized and standardized TMRW address database containing the atrributes I mentioned above. From the very beginning, this can help us better understand where the user lives and use it for various purposes as I will outline in this POC.

Address Collection Onboarding
Getting a few more details

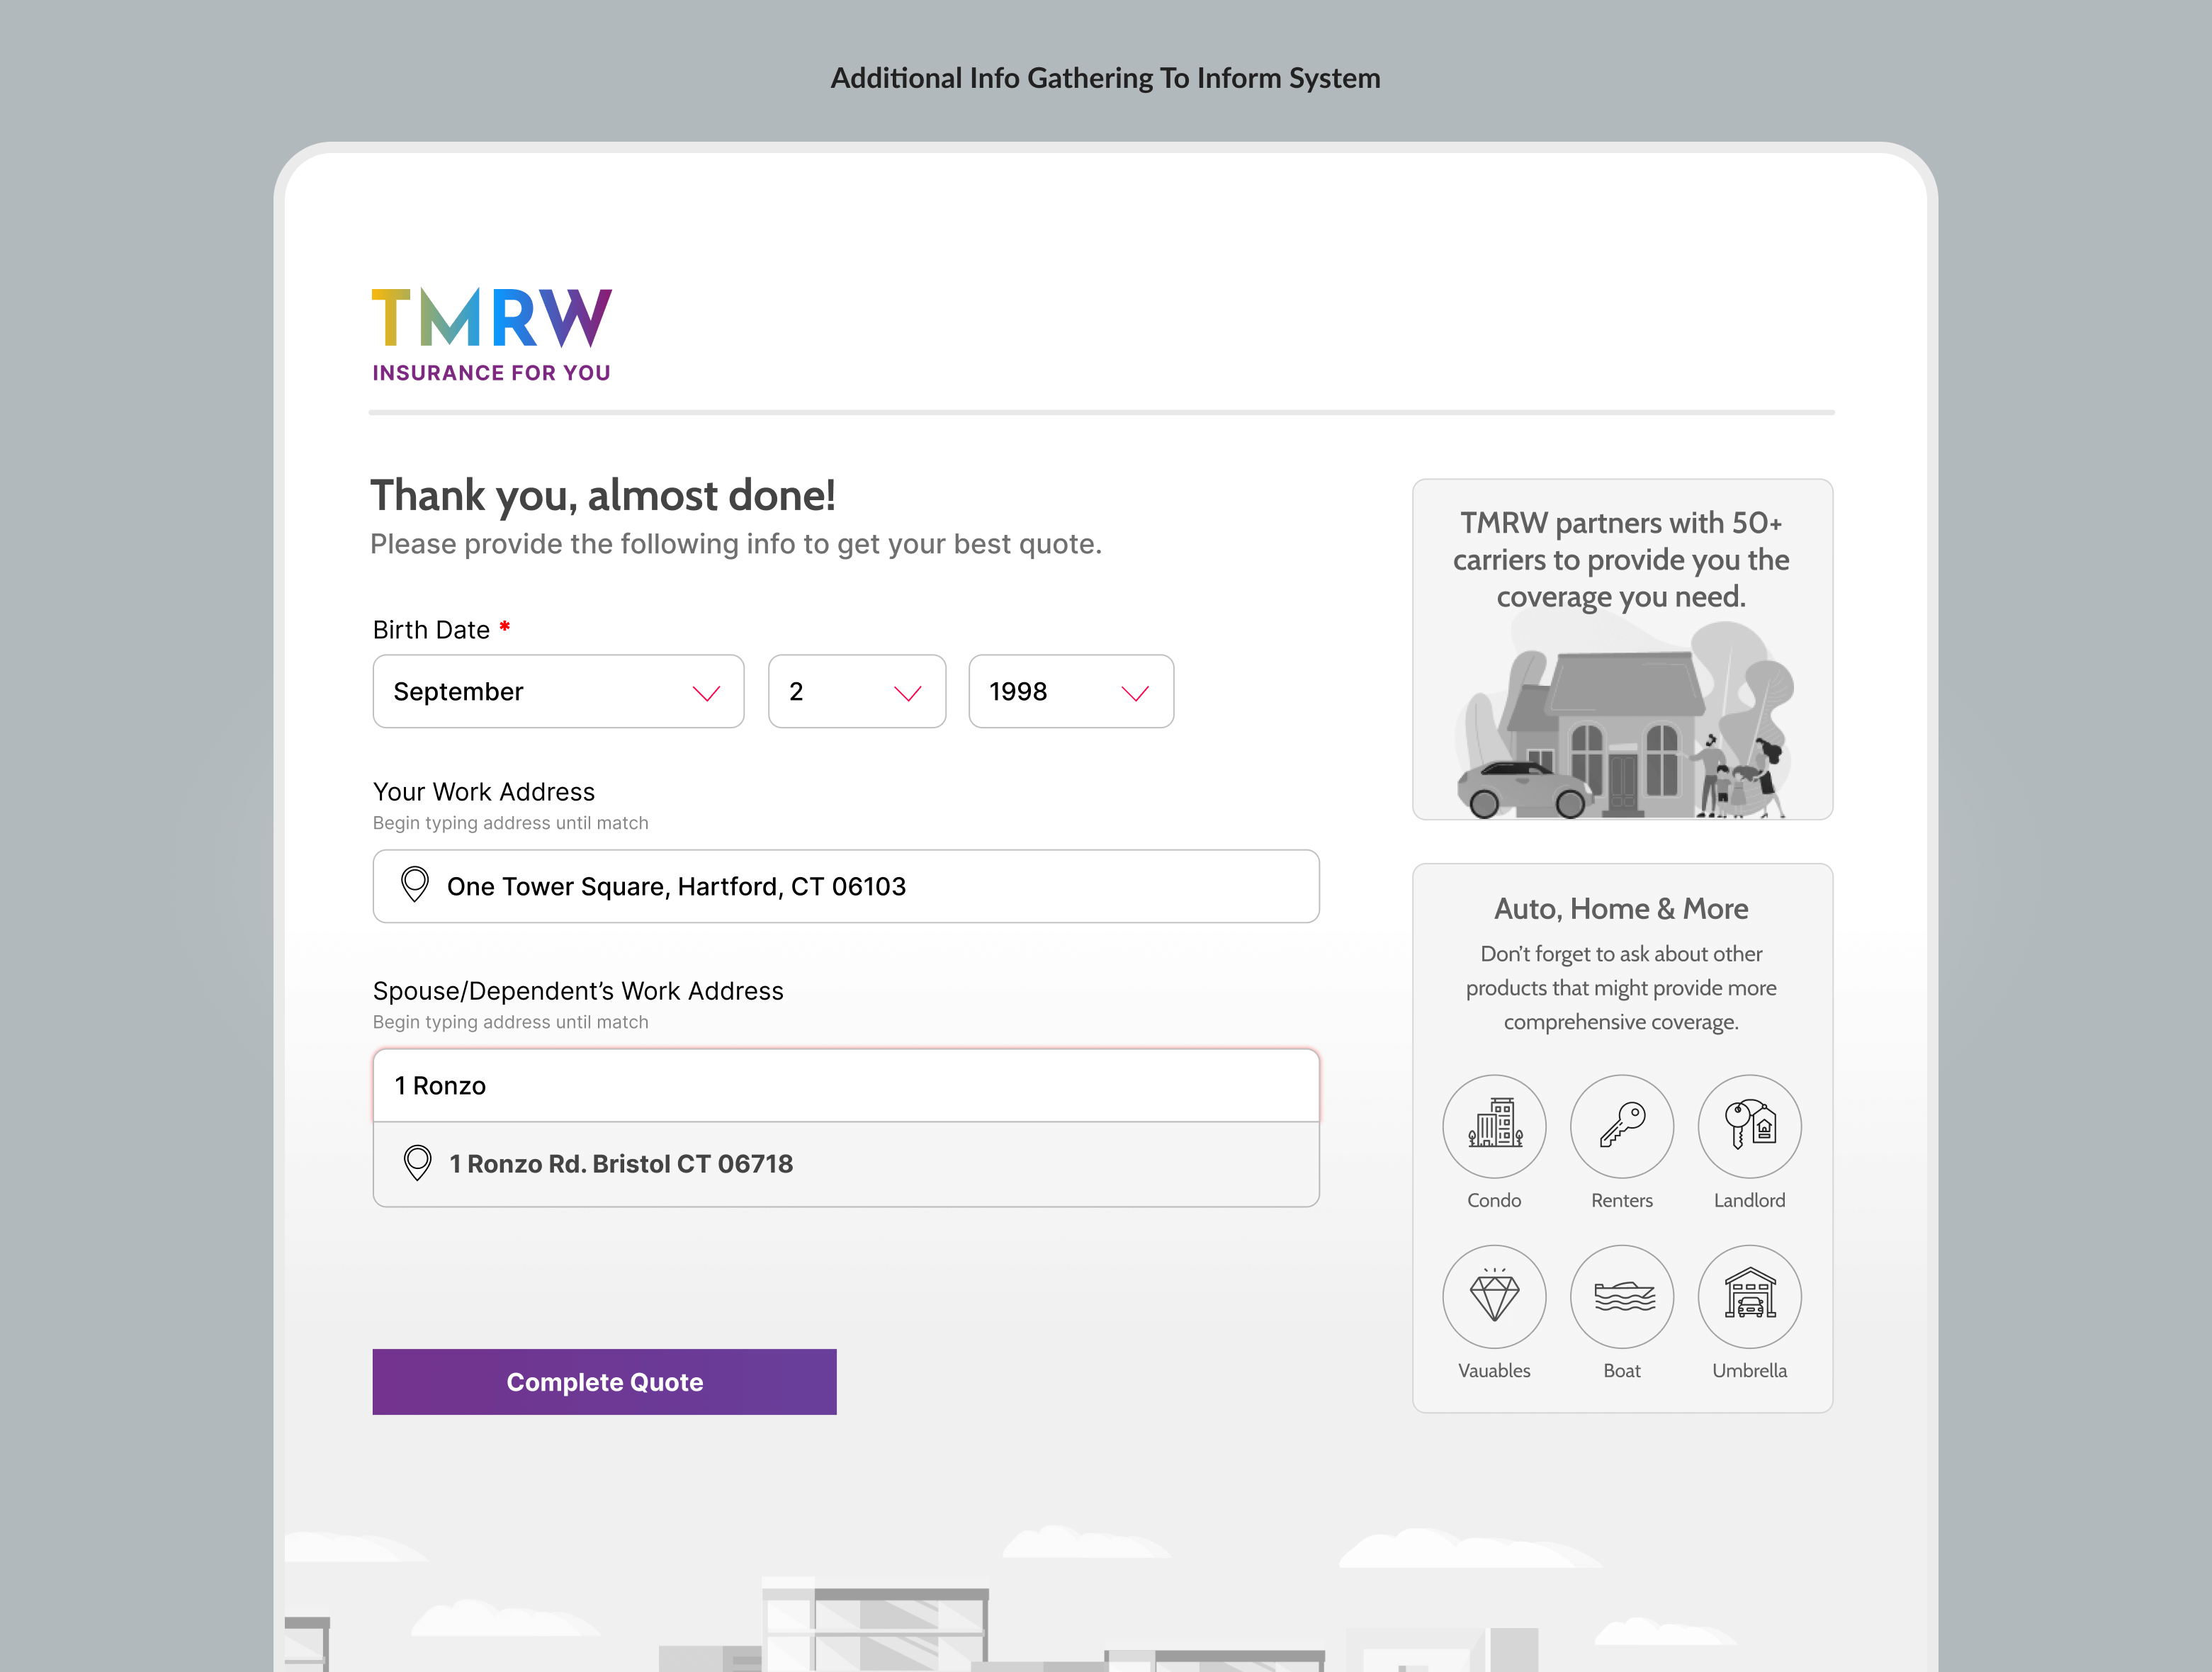
We don't want to increase the volume of information that we ask for up front, so perhaps on subsequent screen, or further in the process we ask the customer to provide their work addresses as well, also type-ahead populated from the TMRW DB. This can potentially be used to calculate how safe their daily commute is as described next.

Address Collection Onboarding
Using home area data to adjust quote

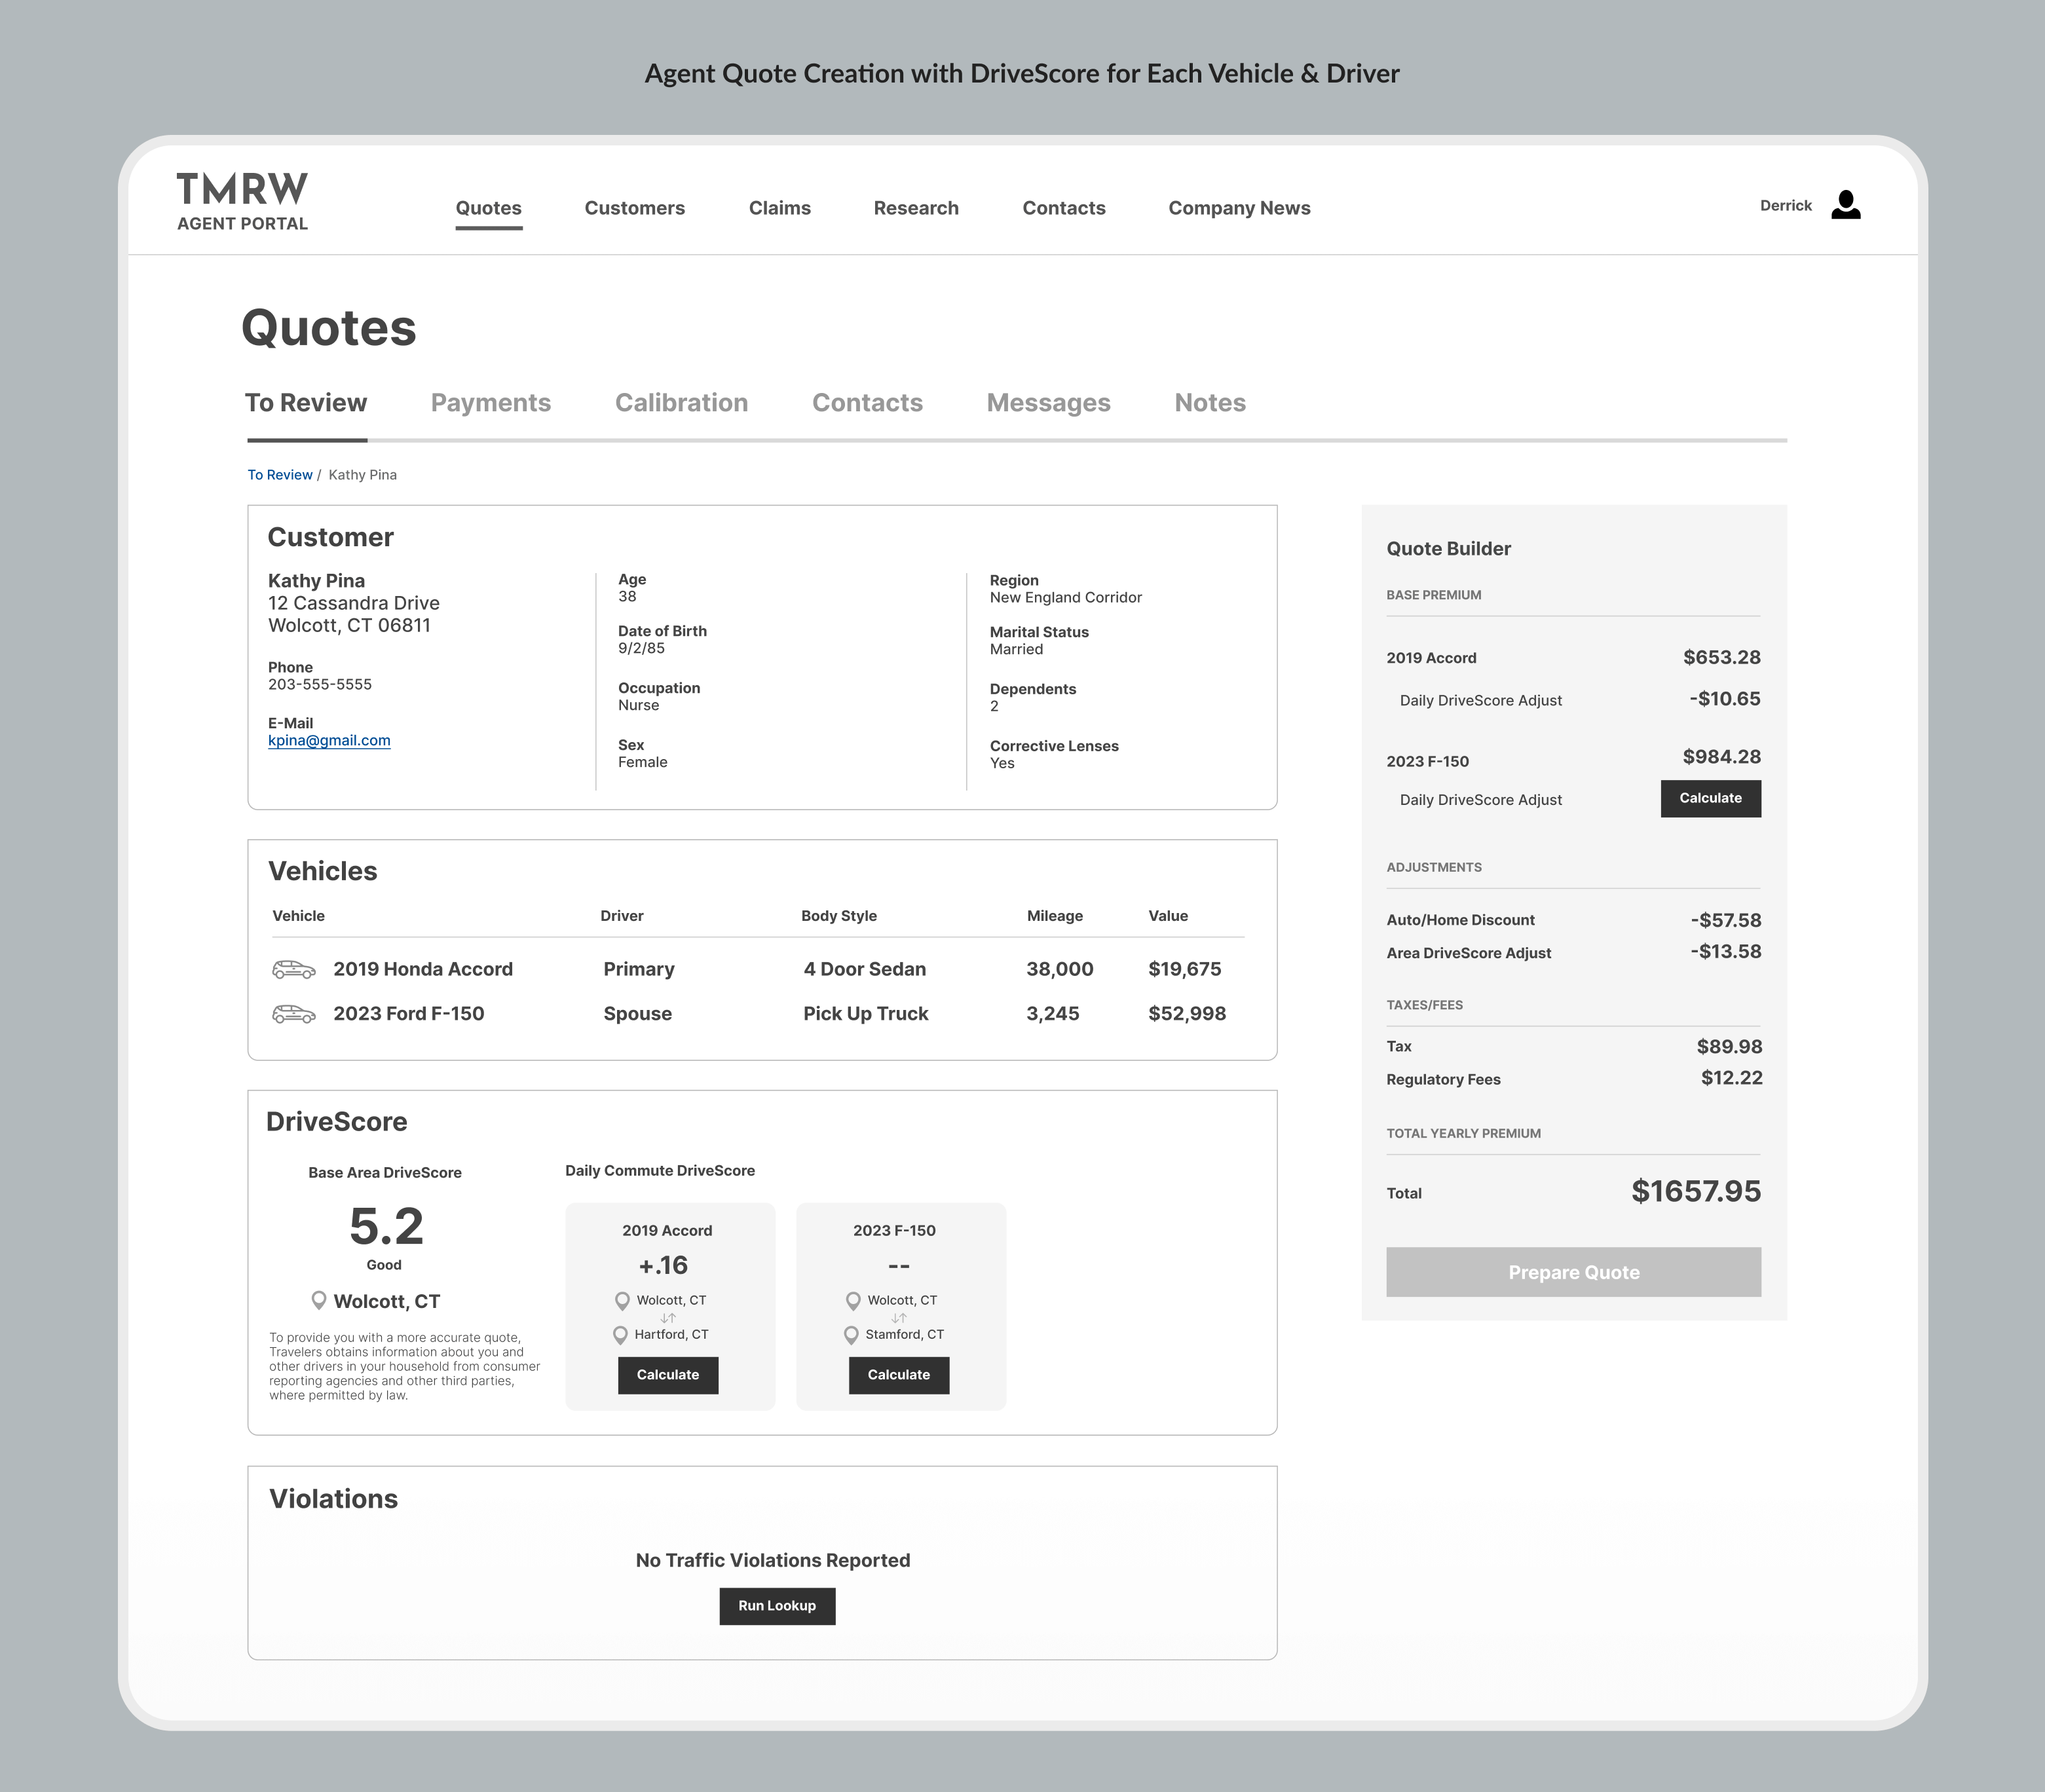
The following screen is showing a hypothetical agent portal where the agent can manage various tasks. I will use this portal for other features in this concept.

With the customer having entered their address directly mapping to the TMRW database, we can easily look up the overall driver safety score for their area. I branded this "DriveScore" for this exercise. This could be calculated with a combination of TMRW claim history and public records that also use this new universal address format. The DriveScore could lower or raise the premium for the quote.

In addition to DriveScore, using the work addresses provided during onboarding, we can get a CommuteScore for each driver to make a small adjustment to their DriveScore.

Quote Creation
CommuteScore calculator

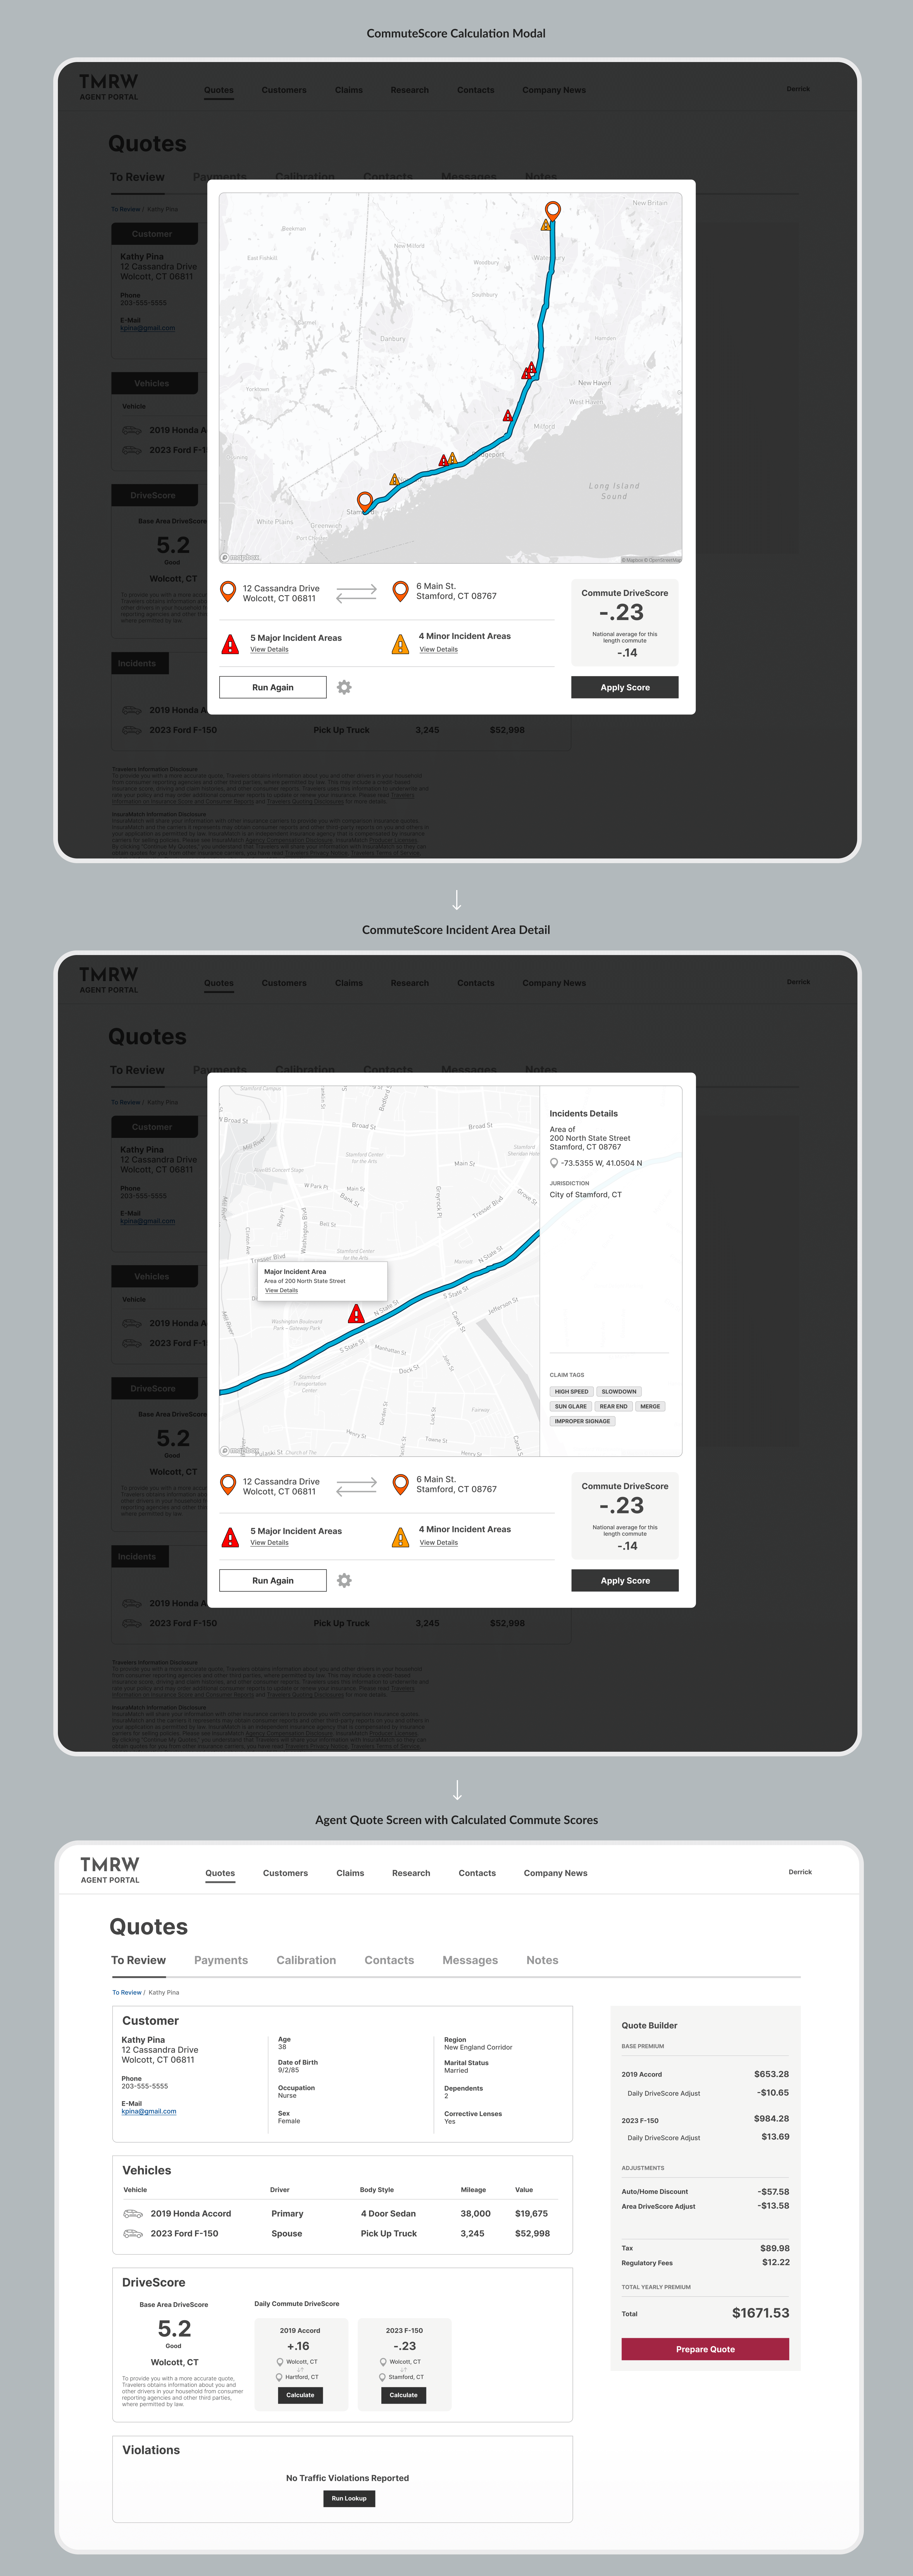
Before completing the quote the agent can calculate the CommuteScore for all drivers. A visual representation of their most likely commute and hazard areas along the way are displayed. These hazard areas are based off TMRW claim histories and public data that TMRW imports on a regular basis. Since they are both in the same address format, they are easily mapped and cross referenced. Based on the overall safety of the commute, a CommuteScore is assigned.

The agent can interact with the map if they'd like and view individual problem areas. This could be for their own education to help understand how the CommuteScore is calculated, or to educate the customer further down the road if needed. Obviously there are many factors to determine a driver's route, but this is a high level idea to consider for this exercise.

DriveScore Calculation
Claim incident location & tagging

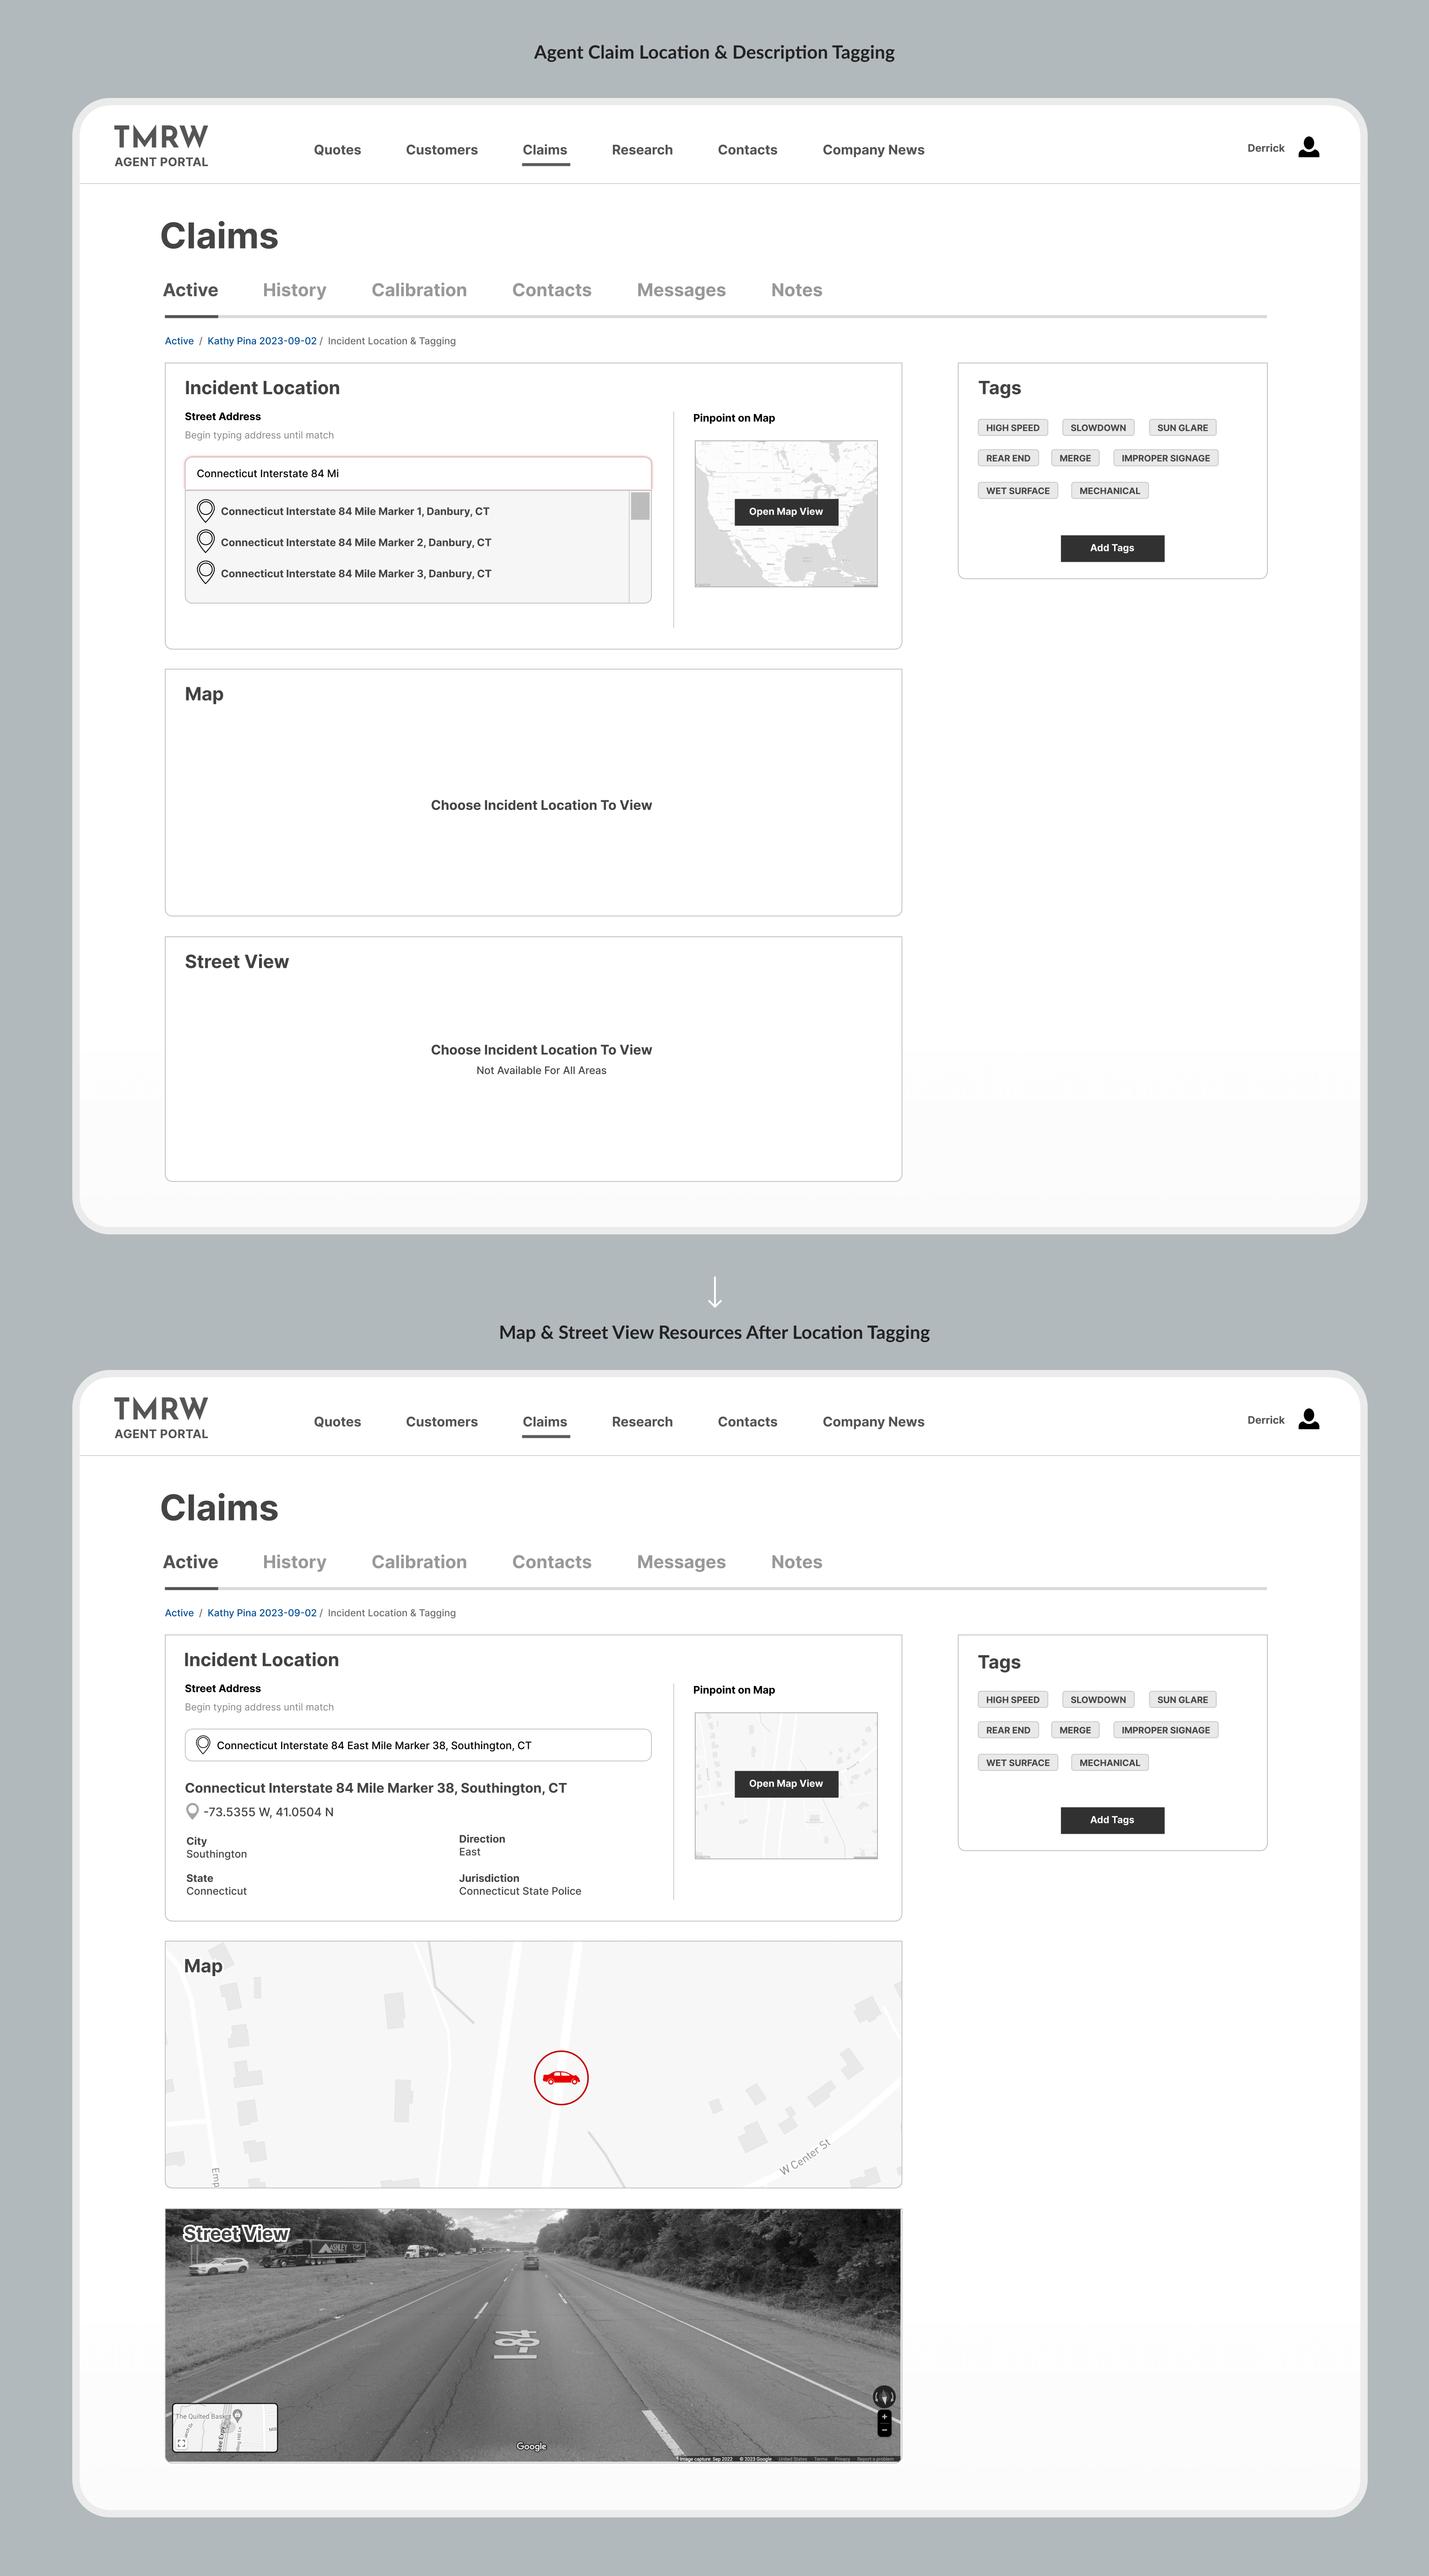
Since a lot of this concept is powered by claim data, it's important that when a claim is entered, it's also being mapped to the location it occured accurately.

Using the portal, the agent will choose the incident location from the type ahead input. (The customer can also do this if making a self service claim in the app). As you can see here highway data is also available and driven by mile markers. The agent can also use the map tool to pinpoint the location if they have photos of the accident to reference.

Claim Location
Incident research & reporting

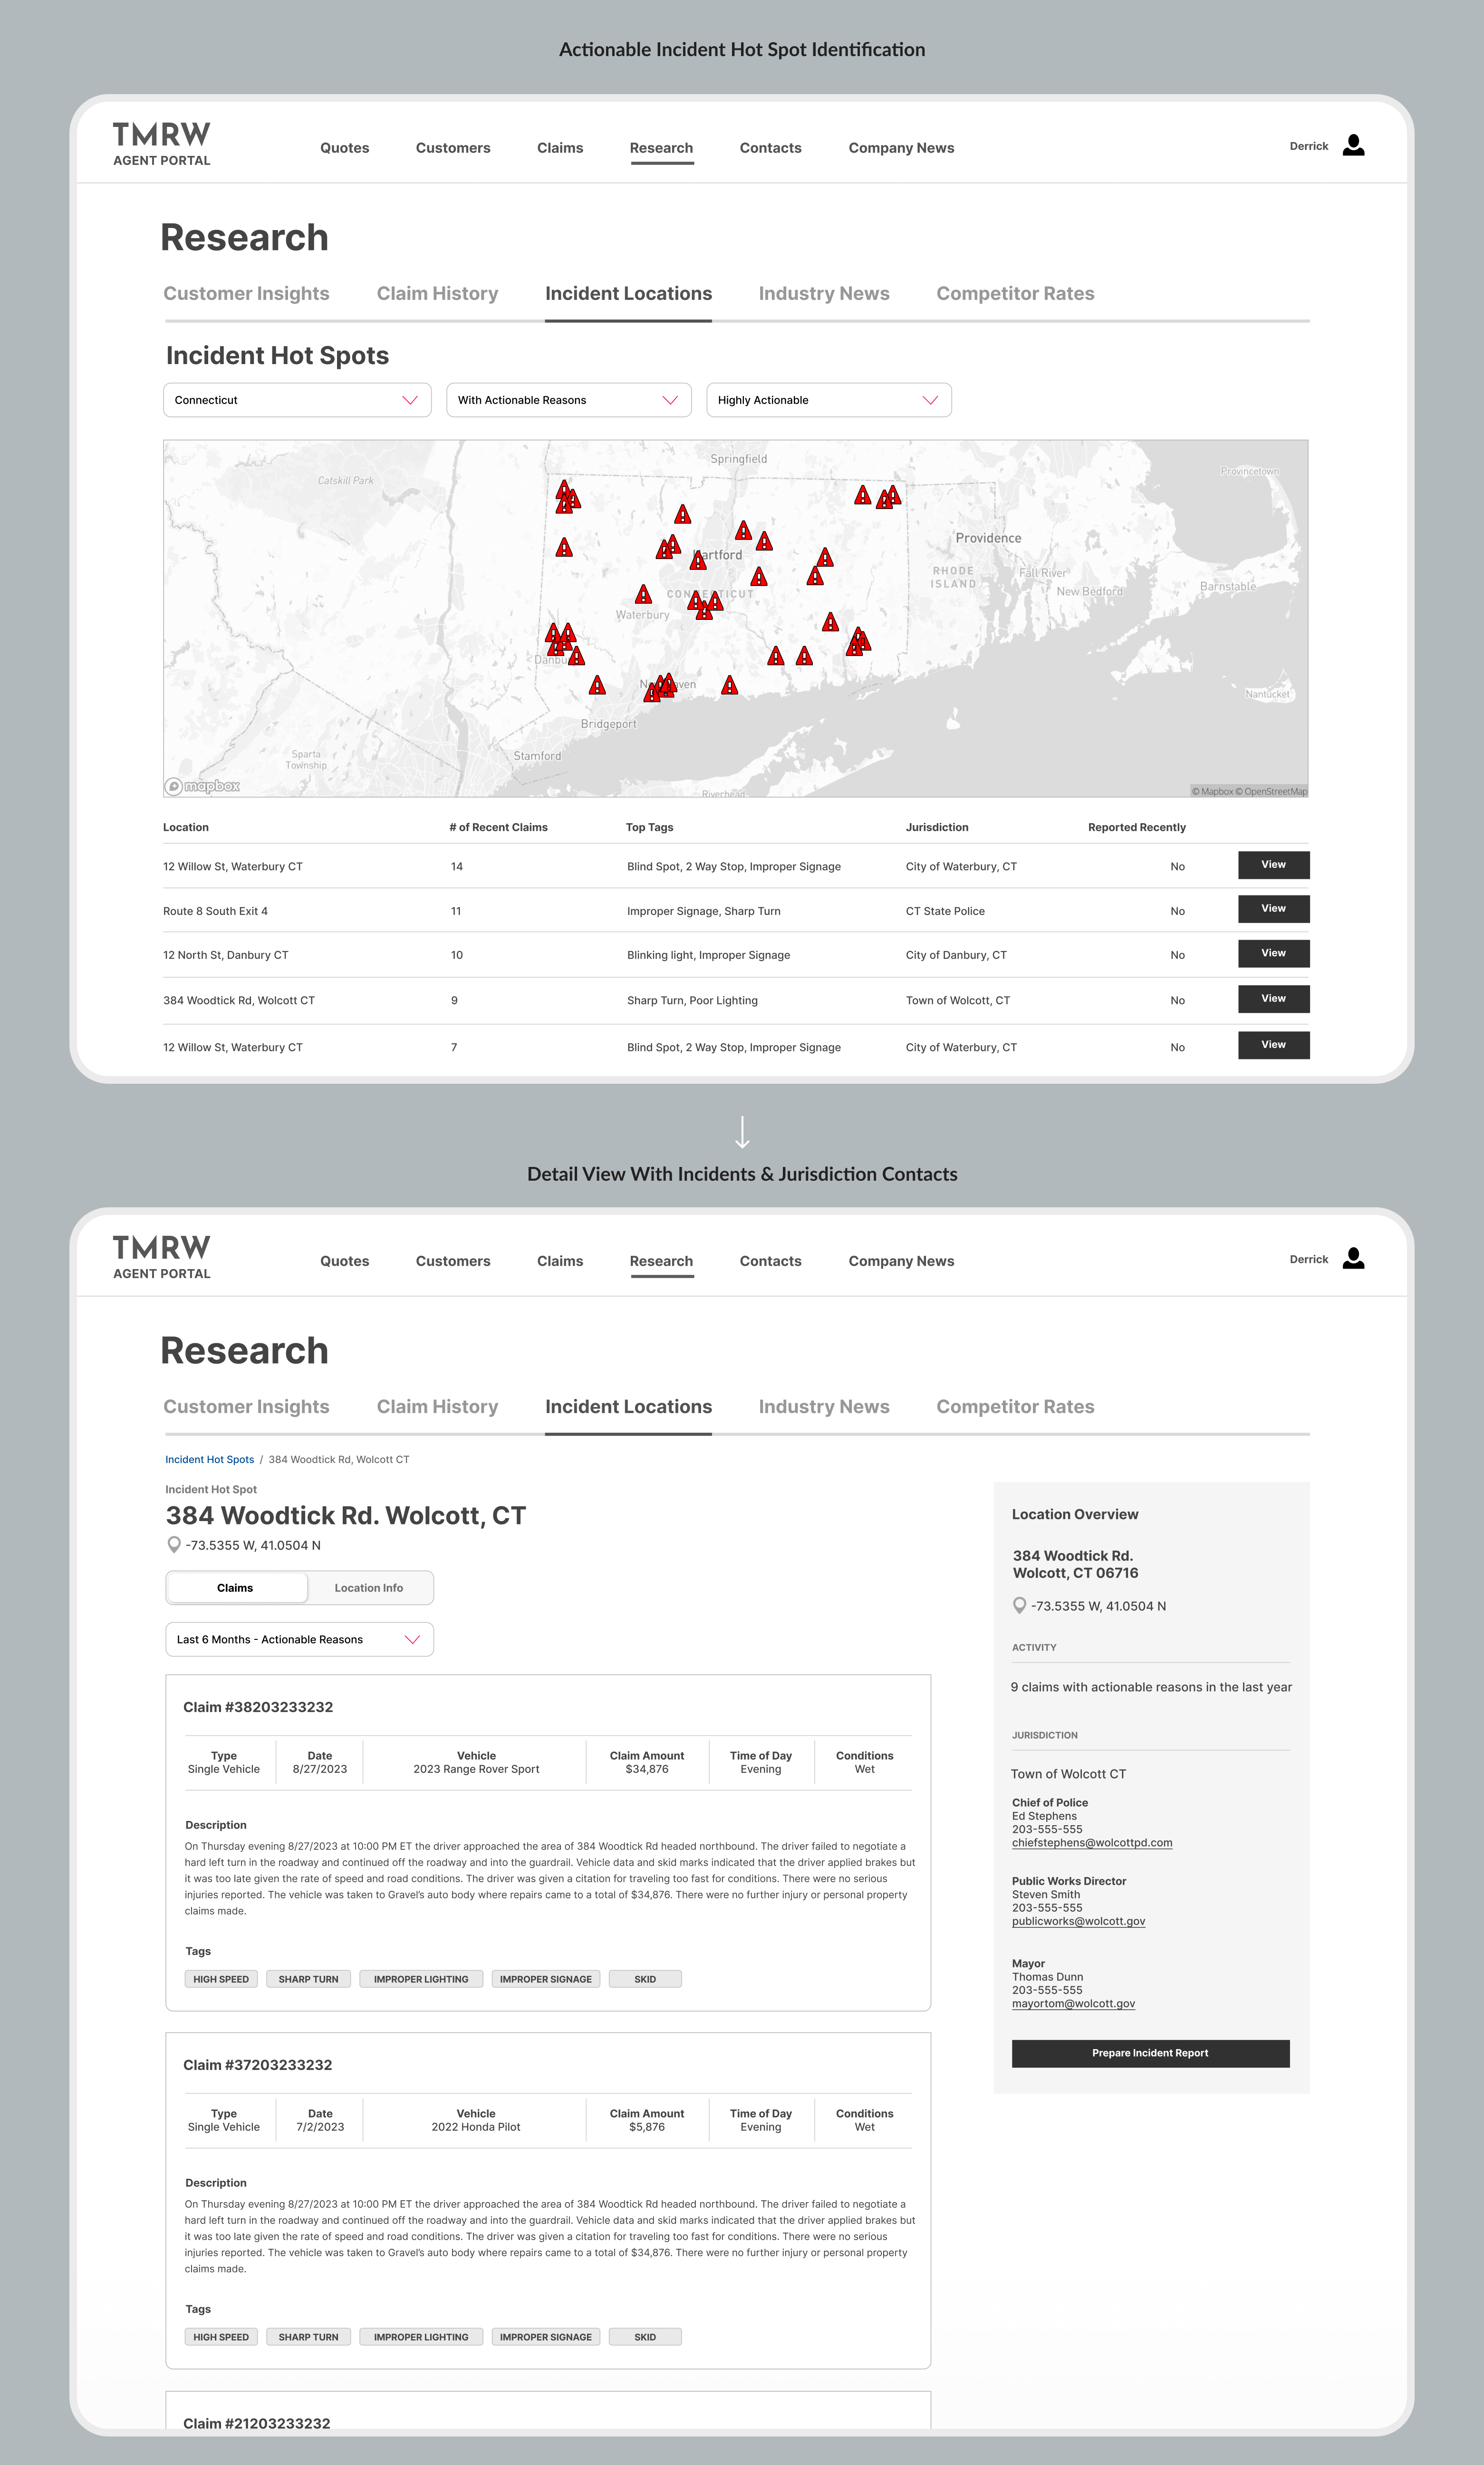
Having incident addresses in a universal format with the ability to search and plot on a map, the risk mitigation department can discover high risk areas with certain tags like “blind spot” and report these to local authorities in a convincing and organized format. If these problems with the roadways are identified and rectified, the company and it’s drivers will be less exposed to these hazards. A win win for the bottom line, it’s driver’s safety, and a great thing to promote to potential new customers.

These screens are showing a research tool where agents can query incident areas by location and type. Areas that have the most incidents and are tagged with accident reasons that could be potentially solved by improved infrastructure are listed first.

The analyst can click on "View" and get the details for that particular location including contact information for the jurisdiction. A "Prepare Incident Report" button will package up the summary of claims to send to the jurisdiction.

Research Incidents
Providing tools to customer

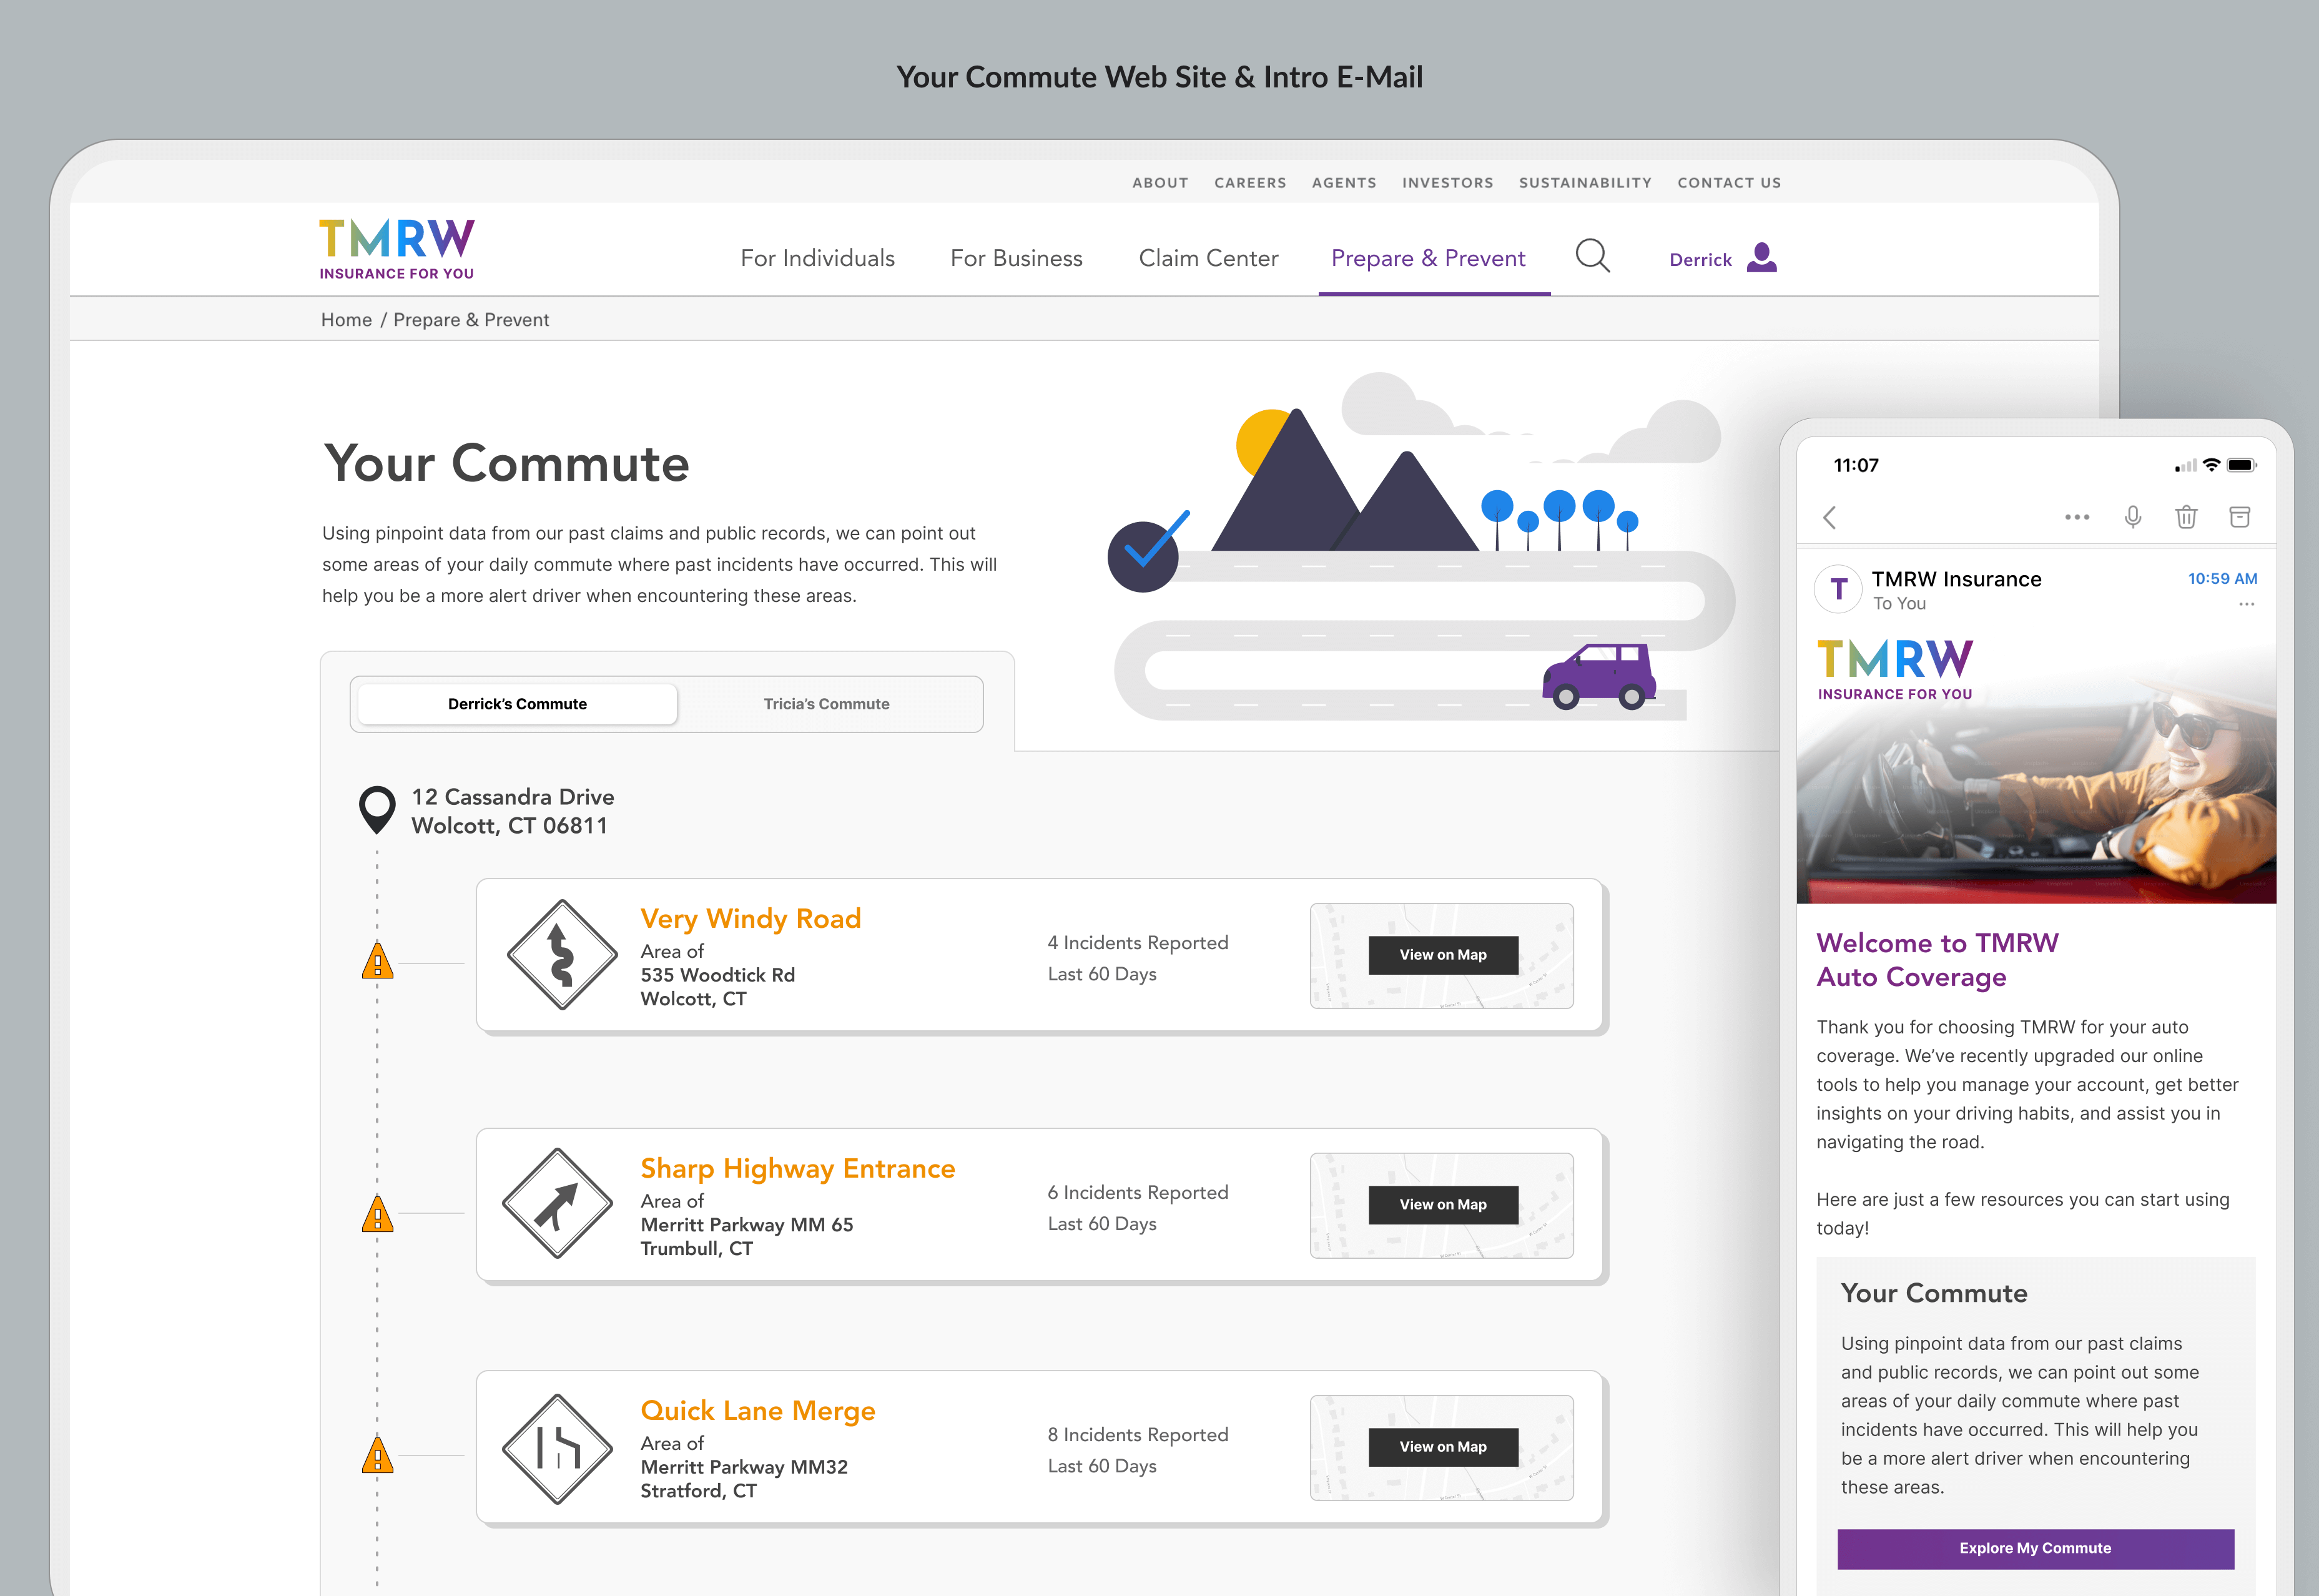
The insurance business is highly competitive and customer service is a big differentiator in picking and staying with a certain provider. Customers have said in research interviews that they wanted to feel like their insurance provider was “looking out for them”. The marketing team has taken a proactive approach in providing services to new customers like education on vehicle maintenance, new driver tips, and other things to watch out for on the road. What can this new incident data provide for them to build upon their efforts?

This example shows an e-mail that a new customer could receive which leads them to an informational page detailing their daily commutes. Using the DriveScore and CommuteScore data we can educate them on some things to be aware of on their daily journey.

Customer E-Mail
Summary
  • With good data like this, AI also can be trained better on the these patterns and run a lot of this analysis.
  • This was a quick exercise to demonstrate my product thinking, user experience, and ability to learn quickly and adapt to an industry I have never designed for. In the real world this would all of course be informed by research, cross functional partnerships and real opportunities for improvement.
  • Hiring a design lead for an industry I have not worked in? Please give me a shot because I have a deep desire to design or lead new challenges.
Thank You!

If you'd like to learn more, please reach out to me.

Return Home